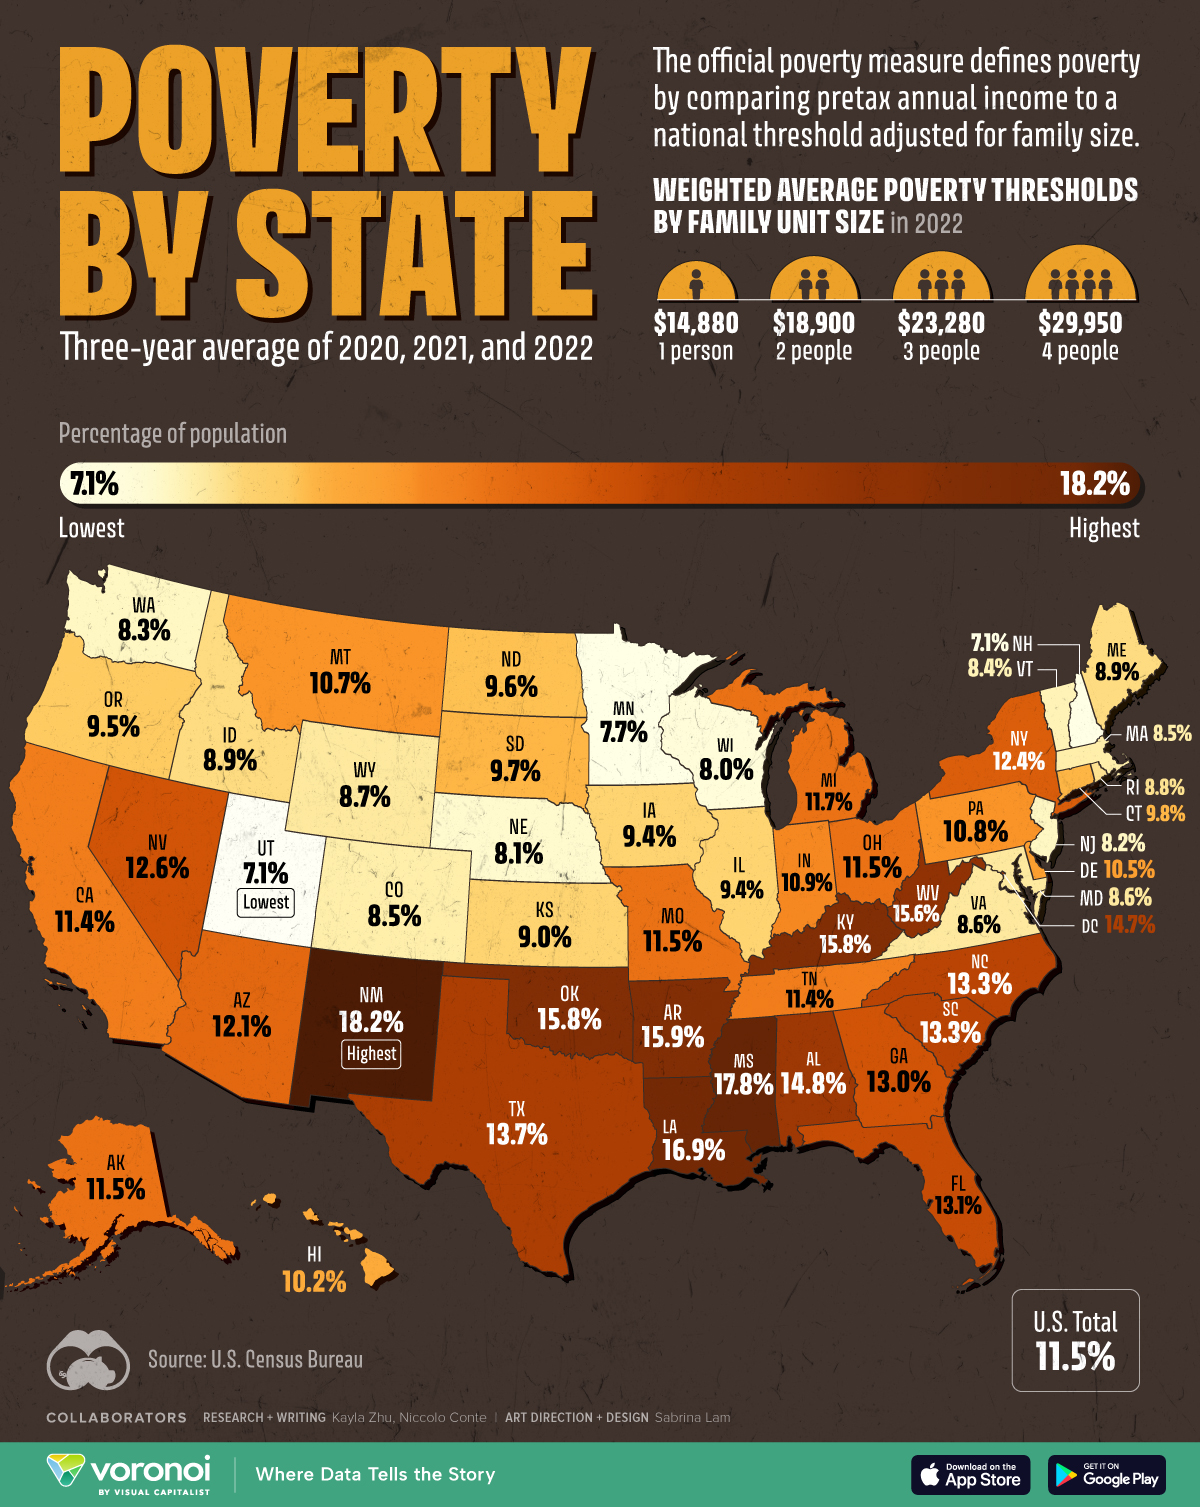
In 2022, 52% of the US population lived in families that were unable to “pay for all the goods and services necessary to fully participate in today’s economy and society without cutting back, as well as save money for emergencies and the future,” a study found.
Over the past 30 years, the wealth held by the top 1% of the US population has significantly increased, and they now control a substantial portion of the nation's total wealth.
US household wealth has significantly increased since 1989, with varying degrees of growth across different income percentiles.
For example, families at the 10th percentile saw their wealth increase from $23 to $450, while those at the 90th percentile experienced a jump from $294,573 to $1.9 million, according to the Urban Institute.
The wealthiest families, exceeding 99% of all families, witnessed their wealth increase more than sevenfold, rising from $1.8 million to $13.6 million, the Urban Institute reports.
This growth in wealth has not been evenly distributed, with the top 10% of Americans owning a substantial 70% of the nation's wealth.
For example, America's richest 0.1% (134,000 households) own $11 trillion in equities, their largest asset class.
This is worth more than the total combined wealth assets of the bottom 50% (66.6 million households).
"In 2022, the Urban Institute found that 52% of people in the United States lived in families that did not have economic security. This means they lacked sufficient resources to meet their basic needs and were not positioned to thrive.
This finding is based on a new measure called the True Cost of Economic Security (TCES) threshold, which considers a more comprehensive set of costs and resources than traditional measures like the Federal Poverty Measure."
“This measure, for the first time, truly helps us understand what every American needs to become economically secure,” says Jennifer Jones Austin, CEO and Executive Director of the Federation of Protestant Welfare Agencies (FPWA) and Co-Chair of the National True Cost of Living Coalition.
Comparing the United States with the European Union
1) Population: US 340m and EU 452m
2) In 2023, life expectancy at birth in the US increased to 78.4 years, up 0.9 years from 77.5 years in 2022, which was still lower than pre-pandemic estimates of 78.8 years in 2019, and 4.1 years below the comparable country average of 82.5.
In 2023, the average life expectancy at birth in the European Union was 81.4 years.
3) What country has the highest deaths due to drugs? the US.
US: National Center for Health Statistics indicate there were an estimated 107,543 drug overdose deaths in the United States during 2023.
EU: Overdose in 2025 was about 7,600.
4) Gun deaths
US
Nearly 47,000 people died of gun-related injuries in the United States in 2023, according to the latest available statistics from the Centres for Disease Control and Prevention (CDC).
"According to the Gun Violence Archive, there have been over 488 mass shootings in the US in 2024, as of the provided information. The Gun Violence Archive defines a mass shooting as an incident where four or more people are shot or killed, and this includes shootings in both public and private locations, according to the Gun Violence Archive. Over the past four years, there have consistently been more than 600 mass shootings annually, averaging nearly two per day, according to the Gun Violence Archive."
EU
In the EU, approximately 6,700 deaths occur annually due to firearms. These deaths are primarily attributed to suicide (around 5,000 cases, or 75%), with homicides accounting for about 1,000 deaths (15%).
Distribution of Household Wealth in the U.S. since 1989
Total Assets Held by the Top 0.1% 99.9th to 100th Wealth Percentiles.
Q1 2021 USD 22,392,029
Total Assets Held by the Top 1%
Q1 2025 USD 50,301,257
Share of Total Assets Held by the 50th to 90th Wealth
Share of Total Assets Held by the Bottom 50%
Q1 2025 5.6%
Board of Governors of the Federal Reserve System (US)
Trump at his inauguration, made sure that the American Royalty would get prominent seats.
US and European
While precise wealth distribution percentages for 1989 and 2025 are not available without extensive historical data, it's well-established that wealth inequality in the U.S. has increased significantly, with the wealthiest holding a larger share.
The top 1% and 10% have seen their wealth share grow, while the bottom 50% has seen a decrease.
Top 1% Dominance: The top 1% of households have significantly increased their share of the nation's wealth.
Top 10% Share: The top 10% of households hold a large and growing proportion of the total wealth, often around 70% according to The American Leader.
Bottom 50%: The bottom 50% of Americans hold a relatively small and decreasing share of the nation's wealth.
Specifics (Approximate): Top 0.1%: In 2025,
WCBD reports that joining the top 0.1% requires a net worth of nearly $62 million.
Top 1%: In the third quarter of 2024, the top 1% held a record $49.2 trillion in wealth, representing over 30% of the total wealth held by U.S. households.
Top 10%: The top 10% of Americans own roughly 70% of the nation's wealth, according to The American Leader.
Important Considerations: Data Limitations: Precise wealth percentages are difficult to obtain due to data collection limitations and varying methodologies.
Dynamic Nature: Wealth distribution is constantly changing, so any snapshot is just that - a moment in time.
Wealth vs. Income: It's important to distinguish between wealth (assets minus liabilities) and income (earnings over a period).
United States big firms have a tax rate 21% and Europe at 21.5% including non-Union countries.
Europe: "During the period from 1995 to 2023, the top 1% of wealthy people in Europe increased their share of the wealth distribution from 22% to over 25%.
Over the same period, the wealth of the bottom 50% of people saw their shares shrink, while the share of wealth owned by the rest of the top 10% remained stable, at between 35 and 36%.


