
In 2020 Savills — the international real estate firm — gave Dublin a 14th ranking in a Top 20 of global tech cities. Last month Dublin was ranked 4th as one of the lead “European cities of the future” ahead of London, Amsterdam and Paris according to the Financial Times’s FDI Intelligence. The Irish capital was 5th overall in the 'Global Cities of the Future' and 3rd place in the “business friendliness” and “economic potential categories.”
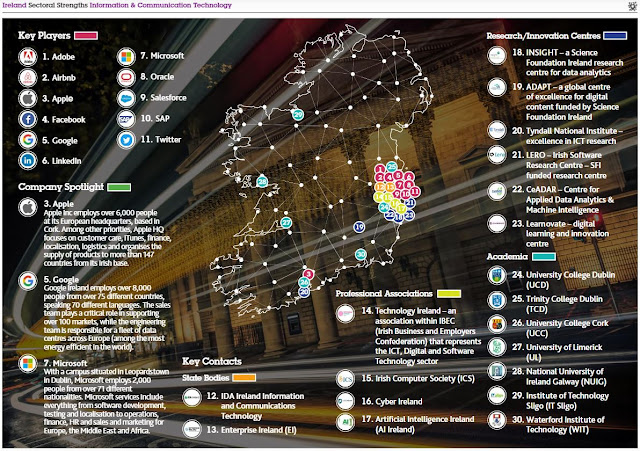
While big tech firms have centralised their European sales and customer support in Dublin, they are also involved in computer programming and software development. Government data for 2020 show that foreign firms had 38,000 people in the latter activities while Irish firms only had 1,700.
Foreign workers accounted for 17% of employment in 2021 (429,000) and the ratio in Information and Technology (ICT) was 35% (breakdown for 2020). ICT is a sub-category of 'Information and Communication' which includes newspapers, broadcasters and telecommunication, and in 2019-2021 40,000 jobs were added.
Residential rents have doubled in the past decade and according to Daft.ie Dublin is 80% more expensive than non-city rents, which is a higher premium than the boom years in 2006 or 2007. However, the permanent staff of the foreign firms don't have to worry. For example, Google has over 4,000 people on the payroll and another 4,000 who are self-employed contractors or employees of services firms such as canteen staff, security etc. Google's average wage in Dublin was €120,000 in 2020 compared with £240,000 in London.
Employment rose from December 2019 (before the pandemic) to December 2021 by 149,000: it included 60,000 part-time workers and 40,000 foreign workers.
In 2021 the population of Dublin was 160,000 above the 2011 level and employment in Dublin by foreign-owned exporters (ex-retail) in 2020 was 117,000 — 40,000 have been added since 2011.
The Dublin region with 28.5% of the national population of over 5m, is the location of choice for Big Tech firms and they are important contributors to the housing crisis along with the lack of competent planning by governments. Brexit also brought more foreign banks to Dublin.
2011-2021
In the period of boom and bust in 2008-2016 (in the 3d quarter of 2012 job losses were followed by low-level growth) net national employment at the end of 2016 was down by over 70,000 persons while Dublin employment was at a similar level to 2008. In 2016-2021 it grew by 460,000.
House completions nationally were 133,300 in 2011-2021 and the County Dublin total was 29,500.
Housing completions in 2019, 2020 and 2021 were 21,000; 20,500 and 20,400 while County Dublin levels were 4,700; 4,600 and 5,000.
The last census in 2016 revealed that the average number of persons per household had risen for the first time since 1966. In 2011 there were on average 2.73 persons per household. The equivalent figure stood at 2.75 in 2016.
The largest increase according to the Central Statistics Office (CSO) "in average household size between 2011 and 2016 occurred in Fingal (2.92 to 3.03) in County Dublin, followed by Dublin City where the average number of persons in a private dwelling increased from 2.40 to 2.48. Four counties (Fingal, Meath, Kildare, South Dublin) had at least three persons per household on average in April 2016.
Dublin City (administrative area of Dublin City Council) had a rise of 27,000 in population in 2011-2016 but there were virtually no house completions in that period.
According to Eurostat, in 2020 "The largest average household size was recorded in Croatia (2.8 members) and in Ireland, Cyprus, Malta, Poland, Romania and Slovakia (all with 2.6 persons in average) while the smallest was observed in Sweden (1.5 members - that number is in dispute), followed by Denmark, Germany, Estonia and Finland (each with 2.0 members)." See data here.

Dwellings per thousand inhabitants 2020
The Organisation for Economic Cooperation and Development (OECD) — a think tank for 38 governments representing 31 advanced countries and 7 emerging economies — measured housing intensity based on data in 2020 or near to it.
The think-tank provides vacancy rates for some countries. Vacant dwellings exclude secondary or holiday homes or dwellings meant for seasonal use.
The number of dwellings per thousand inhabitants (including vacant homes,) was around 461, on average, among OECD countries, compared with the EU average of 491 in 2020.
The target should be at least 500 per 1,000 inhabitants given the growth in single adults without children homes, reflecting both ageing and also the trend of younger people living alone.
The number of dwellings related to population was highest in Greece, France, Portugal, Bulgaria, Finland, Spain and Latvia (with over 550 dwellings per thousand inhabitants) while the number of dwellings reported was the lowest in South Africa (283), Colombia (294), Korea (310: 2013) and Costa Rica (310).
In the period 2011-2020 six countries experienced falls in the ratio: Croatia, Ireland, the Czech Republic, Iceland, New Zealand and Luxembourg. Chile, Lithuania and Turkey reported the biggest rise in the number of dwellings per thousand inhabitants over the period.
Greece was at 595; France 590; Portugal 558; Bulgaria 579*; Finland 558; Spain 557; Latvia 551; Austria 550; Estonia 547; Lithuania 531; Switzerland 529; Cyprus 523 and Germany 509 (13 countries above 500).
Denmark 497; Japan 494; Norway 488; Belgium 483; Sweden 481; Romania 469*; Turkey 464; Netherlands 457 and Hungary 456 (9 countries in the 500-450 range).
Russia 449*; UK (England) 434; Canada 427; the United States 425; Croatia 419*, Ireland 416; Slovenia and Australia 411; the Czech Republic 408; Iceland 399; New Zealand 388; Luxembourg 387; Poland 386; the Slovak Republic 370; Chile 350; Colombia 294; Brazil 343*; Costa Rica 310 and South Korea 310 (2013) and South Africa 279.* (20)
Thirty-six members provided data (Italy and Isreal did not) and *there were 6 associate members.
In September 2021 the Irish Government published a plan, 'Housing for All' to build 330,000 housing units in the decade.
However, if the population again grows by 450,000 in the decade, the ratio in 2030 would be 445.
CSO population projections 2017-2036 and 2017-2051
Discussion
There are two economies in Ireland: the mainly American-owned foreign-owned sector and the struggling indigenous exporting sector. Economic linkages between the two sectors are limited.
Last year Eurostat reported that the consumer price level in the EU was 40% above the average in Denmark and Ireland, while Germany was just 7% above the average. Denmark is a world-class knowledge economy with about two-thirds of exports (goods + services) from domestic firms. Exports from Irish-owned firms are low as is employer firm entrepreneurship.
Ireland is among the poorer of the advanced economies.
Foreign multinationals do not engage in significant innovation in Ireland and only a small number of indigenous firms have reasonable research and development budgets. Data on indigenous firm R&D and venture capital fundraising, are polluted by redomiciled firms (being Irish for tax purposes but with main operations typically in the US).
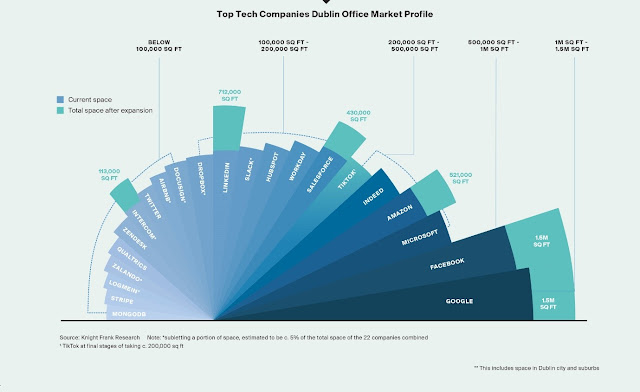
In 2021 Knight Frank, the British real estate firm, forecast that by 2025 the total space occupied by foreign tech companies in Dublin would be 4.5m sq ft — ahead of the 4.1m sq ft these firms occupied in London.
This means more demand for scarce housing.
Fixing the housing crisis should come before more office expansion in Dublin.
Related
Ireland's international economic and social indicators in 2022