

| Export Category | 2025 Value (USD) | Primary Markets & Trends |
|---|---|---|
| Pharmaceutical Products | $24.75 Billion | Led by packaged medicaments, hormones, and blood fractions. |
| Machinery & Boilers | $19.03 Billion | Driven by advanced industrial machinery and wind turbine components. |
| Electrical Equipment | $10.33 Billion | High-tech components, green energy electronics, and grid tech. |
| Mineral Fuels & Distillates | $7.01 Billion | Refined petroleum and growing exports of green methanol/hydrogen. |
| Agricultural & Food Products | ~$5.26 Billion | High global demand for Danish pig meat ($2.86B) and cheese ($2.4B). |
- Germany ($22.4B): Denmark's largest individual trading partner, relying heavily on Danish machinery and agricultural goods.
- Sweden ($13.4B) & Netherlands ($9.5B): Essential regional hubs for supply chain integrations.
- United States ($9.2B): The largest destination for outbound Danish Direct Investment (FDI) and the highest buyer of industrial machinery and medical apparatus. [
Danish goods exports to the United States reached an all-time high of 375 billion DKK (approx. $12.36 billion to $17.2 billion total trade including services) in 2025, while 77.5% of Denmark's total goods exports went to European destinations.
- Total Value: Goods and services exports to the U.S. rose by 14 billion DKK to 375 billion DKK ($12.36 billion in direct U.S. goods imports from Denmark reported via UN Comtrade).
- Driving Sectors: Strong growth was led by pharmaceuticals (including weight-loss medications), medical and technical apparatus, machinery, and optical/photo equipment.
- Market Resilience: Exports expanded despite U.S. tariffs and a weaker U.S. dollar, supported by steady American consumer and business investment.
- Danish Corporate Footprint: Over 950+ Danish-born/owned company affiliates operate in the U.S., employing around 91,000 workers (with certain U.S.-produced goods under Danish ownership exempt from specific import duties).
- European Dominance: Europe remains Denmark's primary economic anchor, absorbing 77.5% of all Danish goods exports by value in 2025 (up from 70.2% in 2024). ]
- Top European Partners: Denmark's largest individual export markets are concentrated heavily within Europe, led by Germany, Sweden, the Netherlands, and Norway (which, alongside the U.S., make up over 42% of total Danish exports).
- Key Export Categories: Wind turbines, pharmaceuticals, specialised machinery, meat, dairy, and design goods.
- Asia: Ranked as Denmark's second-largest regional destination, accounting for 11.4% of export sales.
- North America (Excluding U.S. bulk): Combined with Canada and regional flows, North America accounts for roughly 7.4%.
- Other Regions: Latin America and the Caribbean (1.4%), Oceania led by Australia and New Zealand (1.2%), and Africa (1.1%).
- Global Danish Brands: Iconic born-in-Denmark companies such as LEGO®, ECCO, Pandora Jewellery, and Carlsberg continued shipping consumer goods to over 90+ global markets.
Client companies supported by Enterprise Ireland achieved record total exports of €38.86 billion in 2025, marking a 7.6% _ to 8% increase compared to the previous year.
- United Kingdom: Reached €11.10 billion (up 10%), accounting for 29% of total exports.
- Europe: Matched the UK share at €11.10 billion (up 6%), with the Eurozone contributing €10.18 billion (up 10%).
- North America: Reached €7.34 billion (up 1%), representing 19% of total exports. U.S. at about 5.5 billion.
- Nordic Countries: Saw a notable 39% increase, heavily driven by high-tech construction and data centre activity. No data.
- Advanced Manufacturing, Construction, and Life Sciences: The top-performing sector, growing 14% to €13.16 billion.
- High-Tech Construction and Climate Tech & Renewable Energy: Both portfolios recorded strong growth of 24%.
- Digital Technologies: Grew by 12%. Would you like more details on a specific geographic market or sector breakdown from the 2025 results?
- The Annual Report for 2025 was published in 2026
Discussion
- Denmark: ~6,042,125 people
- Ireland: ~5,562,212 people.
Foreign multinationals, mostly American multinationals, booked just under $300 billion in profits in Ireland last year.
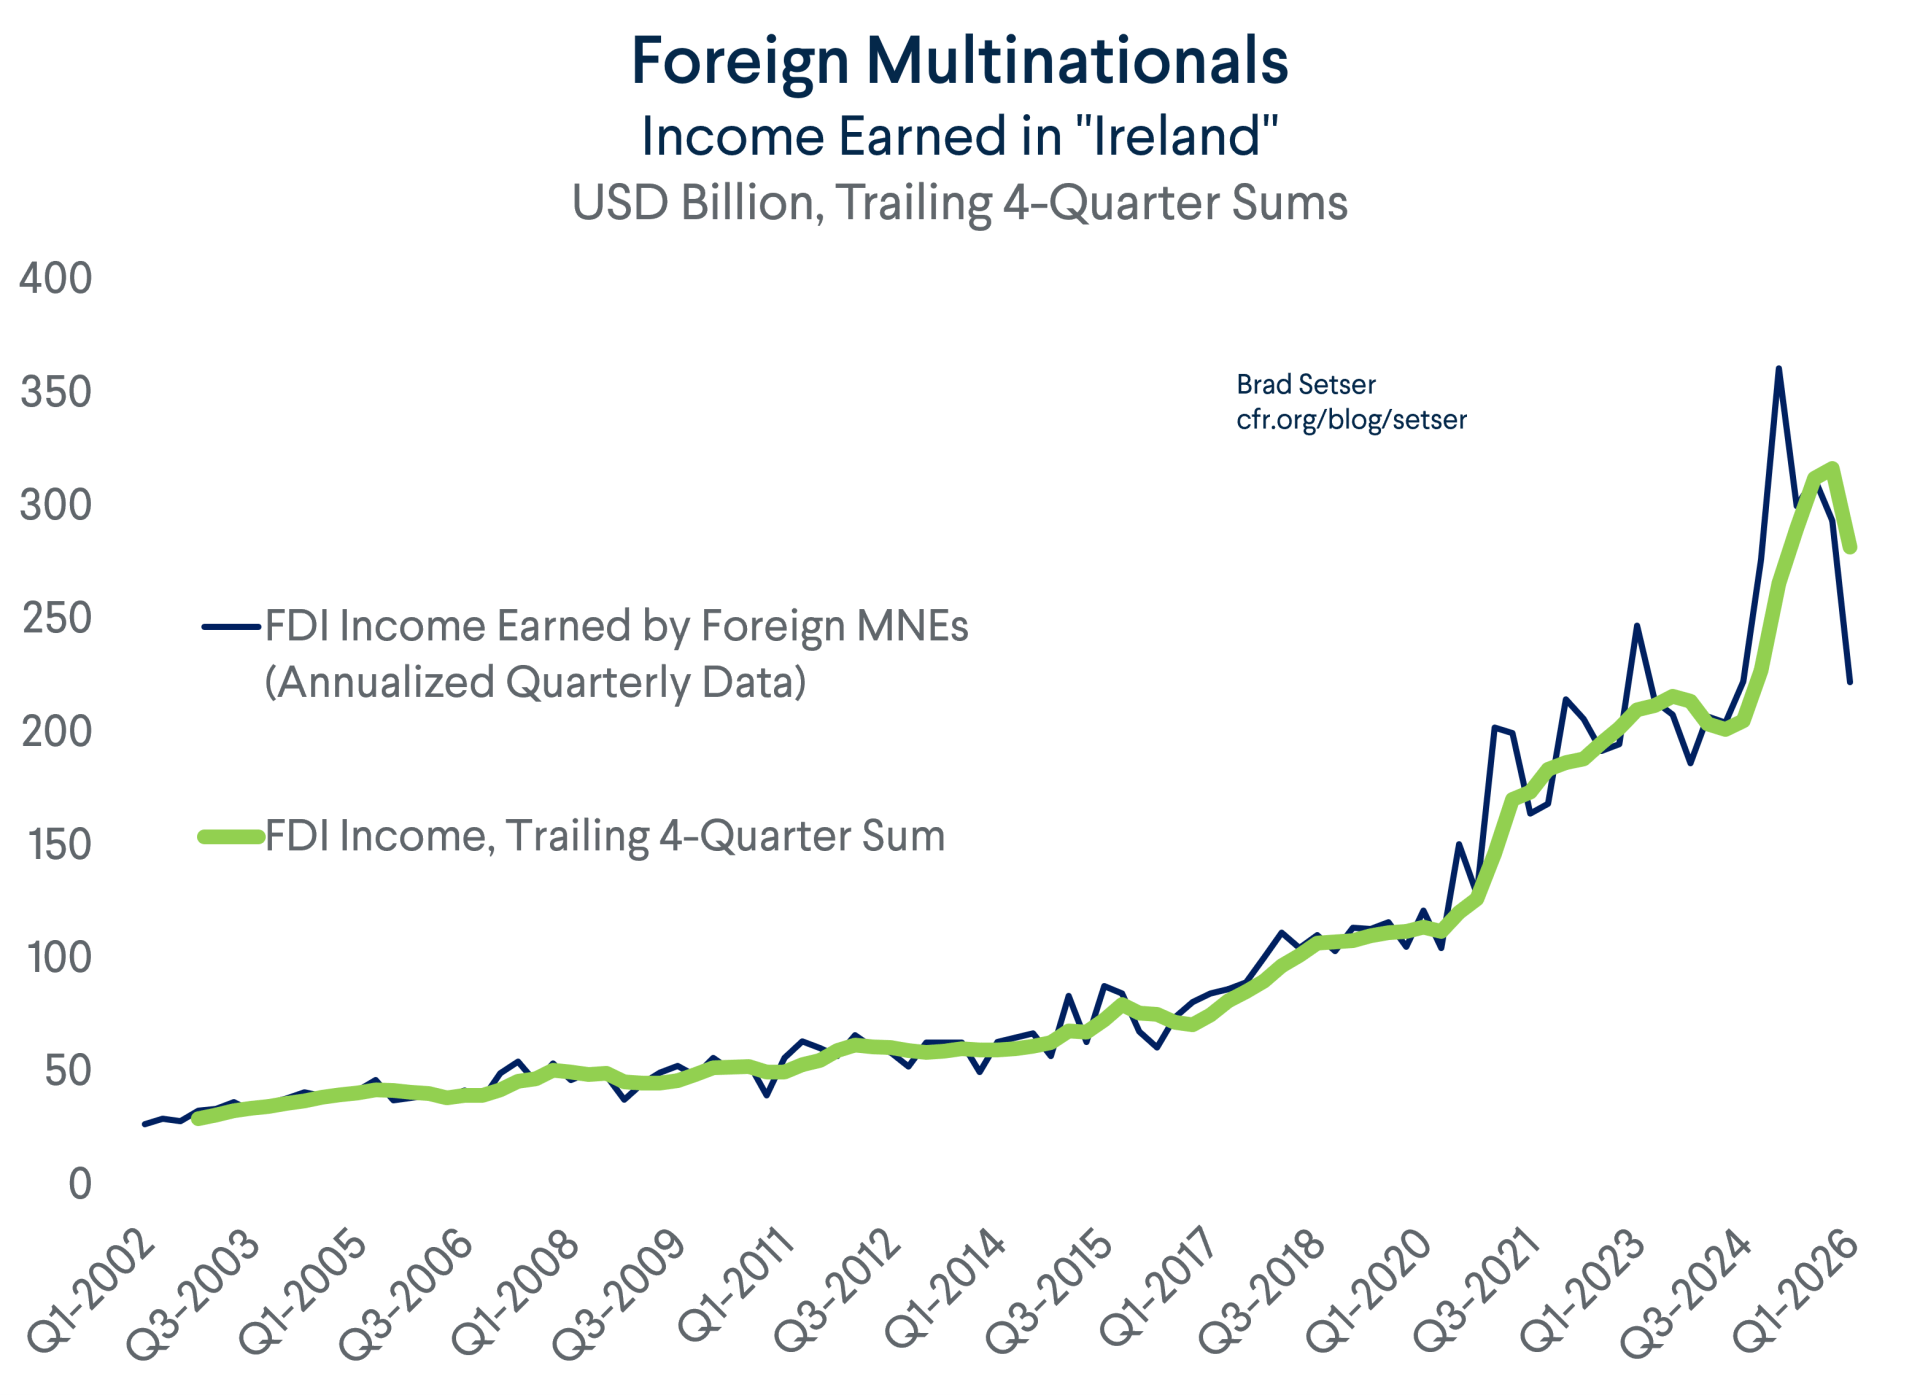
That isn’t just because Ireland used to have a 12.5 per cent headline corporate tax rate, and its current 15 per cent rate on large firms is below the U.S. headline rate of 21 per cent.
In 94 years, from 1932, only 11 multinational firms have been born in Ireland.
1) Irish Bottle Company 1932 (Ardagh; U.S.operation and headquartered in Luxembourg)
2) Jefferson Smurfit 1934 (Smurfit Westock, New York Stock Exchange)
3) Glanbia 1964
4) Kingspan 1965
5) Cement Roadstone 1970 (Cement Roadstone, New York Stock Exchange)
6) The Kerry Cooperative Society, 1972
7) Glen Dimplex 1973
8) DCC 1976
9) Ryanair 1984
10) ICON 1990 Ticker & Exchange: Traded on Nasdaq under the symbol ICLR
11) Fineos Corporation 1993
12) Flutter's Dublin operation runs a unit which manages activities across the UK and Ireland. New York Stock Exchange 2026.
Ryanair is the biggest airline in Europe
- Number of Companies: 1,002 U.S.-owned companies currently operate facilities and regional hubs in Ireland.
- Direct Employment: U.S. companies directly employ 245,000 people in Ireland.
- Indirect Employment: Roughly 175,000 additional jobs are indirectly supported by U.S. operations in the country.
- Investment Scale: Total U.S. investment in Ireland reaches hundreds of billions of dollars, positioning Ireland as a vital gateway to the European Union's market of over 450 million consumers.
- Future Intentions: Approximately 95% of U.S. multinationals view Ireland positively as an investment base, with two-thirds planning increased spending on AI, automation, and data analytics.
- Technology & Digital: Hosts European, Middle Eastern, and African (EMEA) headquarters for major giants like Apple, Google, Microsoft, Meta, Intel, and AWS.
- Pharmaceuticals & MedTech: Ireland functions as a top global exporter of pharmaceuticals and medical technologies, hosting numerous FDA-approved manufacturing plants and major players like Eli Lilly


